










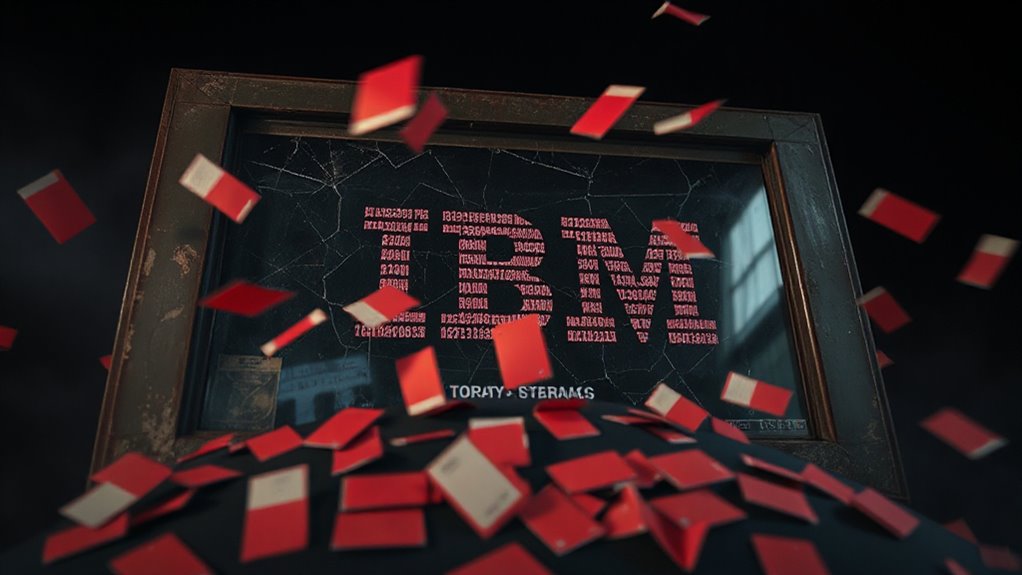
What Actually Caused IBM’s 25% Single-Day Crash?
On July 14, IBM suffered its worst single-day stock crash ever, losing about 25% of its value in one trading session. That wiped out roughly $67 billion in market value.
The trigger was a preliminary revenue warning showing second-quarter sales near $17.2 billion — about $660 million below expectations.
So what happened? Enterprise customers basically raided their budgets to buy servers, storage, and memory chips before prices climbed higher. That left little money for IBM’s software and mainframe products.
Several large deals also missed the quarter-end deadline. Together, these two problems turned a small shortfall into a historic collapse. Adding further pressure, Anthropic announced that Claude Code could automate the modernization of legacy COBOL systems, a key vertical for IBM’s mainframe business.
While IBM collapsed, cybersecurity stocks rallied, with CrowdStrike, Zscaler, Palo Alto Networks, and Fortinet all moving higher as investors rotated away from broader software names into the security segment. Market-driven shifts like this underscore how competition and innovation redirect capital across sectors.
Why IBM’s Implied Volatility Hit a 99th-Percentile Reading?
That historic 25% single-day drop did not just rattle IBM shareholders — it sent the options market into a near-panic.
CNBC reported IBM’s one-month implied volatility hit the 99.6th percentile.
IBM’s one-month implied volatility skyrocketed to the 99.6th percentile, signaling extreme market uncertainty following the historic single-day collapse.
Think of it like a weather forecast suddenly predicting a category-five hurricane after weeks of sunshine.
IBM’s revenue came in at $17.2 billion against an expected $17.9 billion.
That miss raised bigger questions about whether customer spending had shifted permanently toward servers and storage.
Traders kept option prices high because the uncertainty felt unresolved. The implied volatility skew, a measure of how much puts cost relative to calls, registered at 0.0123, reflecting a modest but telling tilt toward downside protection.
Only the 2020 pandemic plunge ranked higher in IBM’s own volatility history. The drop erased $67 billion from IBM’s market capitalization in a single session.
AI-driven pattern recognition models identified elevated risk across options flows, contributing to rapid adjustments in implied volatility.
What IBM’s Crash Reveals About AI Hardware Spending?
While IBM’s stock collapse shocked Wall Street, it also told a surprisingly clear story about where corporate technology money is flowing. Companies are rushing to buy AI hardware like servers, memory chips, and storage systems. Think of it like a kid spending their whole allowance on a new gaming console and skipping the video games for now.
IBM’s customers shifted budgets toward hardware before prices climbed higher. That left software deals unfinished and consulting flat. AI spending did not disappear. It simply moved.
The crash revealed that AI infrastructure is winning the budget battle inside corporate IT departments right now. IBM’s Distributed Infrastructure revenue jumped 37% in the quarter, confirming that hardware demand absorbed the dollars that never reached software. This trend highlights how capital appreciation in tech assets can reshape corporate purchasing priorities.
How the IBM 190/245 Short Strangle Turns Elevated IV Into Income?
After IBM’s stock crashed, something interesting happened in the options market: fear drove up the price of options contracts to nearly historic levels.
One-month implied volatility hit the 99.6th percentile. Think of it like surge pricing after a storm.
Options became unusually expensive. That created a rare chance to sell them at inflated prices.
The IBM 190/245 short strangle collects about $11.25 per contract upfront.
That equals a 5.18% yield over just 38 days.
The trade wins if IBM stays calm and time slowly chips away at those pricey options.
High fear became the opportunity. The short strangle profits most when IBM stays between the two strikes through expiration, with maximum profit capped at the total credit received.
The 190 put strike sits below IBM’s current price while the 245 call strike sits above it, making both options out-of-the-money at entry.
Managing position size and predefined loss limits helps contain potential losses during such setups, especially to control drawdown risk.
Where the IBM Short Strangle Breaks Down?
Selling expensive options sounds like a great deal, but every trade has a point where it stops working.
For the IBM 190/245 short strangle, two danger zones exist.
On the upside, losses grow if IBM rallies past the short call strike and keeps climbing. There is no ceiling on how bad that gets.
If IBM keeps climbing past the short call strike, losses have no ceiling and no mercy.
On the downside, a sharp drop below the short put strike creates serious damage fast.
IBM gapping lower is like a surprise rainstorm with no umbrella nearby. Time decay works in favor of this trade, as both options steadily lose value the closer they get to expiration.
Either way, a strong trend in either direction turns this calm income trade into a stressful situation requiring quick action. The maximum potential profit for this position is capped at the total premium received, meaning the reward is fixed while the risk is not.
Consider setting stop-loss orders to manage outsized downside exposure and limit position-level losses.